
In today’s competitive market, measuring the effectiveness of your marketing campaigns is crucial for success. Utilizing Key Performance Indicators (KPIs) provides quantifiable metrics to track progress, identify areas for improvement, and ultimately demonstrate the return on investment (ROI) of your marketing efforts. This article will explore the top 10 KPIs you should be monitoring to ensure your marketing success. Understanding and tracking these KPIs will empower you to make data-driven decisions, optimize campaigns, and achieve your marketing objectives. From website traffic and lead generation to customer lifetime value, these metrics offer invaluable insights into the effectiveness of your marketing strategies.
Whether you are focused on brand awareness, lead generation, or driving sales, selecting the right KPIs is paramount. This list of the top 10 KPIs will provide a comprehensive framework for evaluating marketing success across various channels, including digital marketing, social media marketing, and traditional marketing efforts. By understanding these KPIs, you can accurately measure the impact of your marketing investments, optimize campaigns for maximum ROI, and ultimately achieve your desired business outcomes. Continue reading to discover the essential KPIs for measuring marketing success and learn how to leverage them to enhance your marketing performance.
Customer Acquisition Cost (CAC)
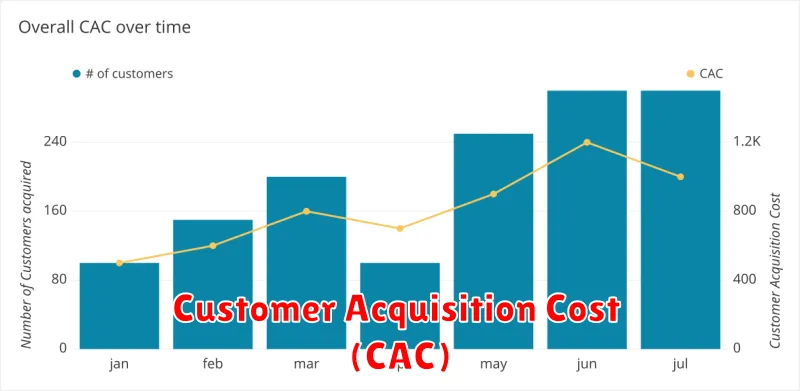
Customer Acquisition Cost (CAC) refers to the total cost a business incurs to acquire a new customer. Understanding your CAC is crucial for evaluating the efficiency and effectiveness of your marketing campaigns.
A high CAC can indicate inefficiencies in your marketing strategies, while a low CAC suggests that your acquisition efforts are cost-effective. Tracking CAC allows you to optimize campaigns, allocate resources effectively, and improve your overall return on investment (ROI).
Calculating CAC involves dividing the total marketing and sales costs associated with acquiring new customers during a specific period by the number of customers acquired during that same period.
Example:
| Total Marketing & Sales Costs (Q1): | $10,000 |
| New Customers Acquired (Q1): | 100 |
| CAC: | $100 |
Customer Lifetime Value (CLV)
Customer Lifetime Value (CLV) represents the total revenue a business can reasonably expect from a single customer throughout their entire relationship. It’s a critical metric for understanding the long-term value of acquiring and retaining customers.
Calculating CLV helps businesses make informed decisions about sales, marketing, product development, and customer support. By understanding the potential revenue each customer brings, companies can optimize their spending on customer acquisition and retention strategies. A higher CLV indicates a healthier business model with strong customer relationships.
Several factors influence CLV, including:
- Average purchase value: The average amount a customer spends per transaction.
- Purchase frequency: How often a customer makes a purchase.
- Customer lifespan: The average length of time a customer remains a paying customer.
Conversion Rate
Conversion rate measures the percentage of visitors or leads who complete a desired action. This action could be anything from making a purchase on an e-commerce website to signing up for a newsletter or filling out a contact form. It is a key indicator of the effectiveness of your marketing campaigns in driving desired outcomes.
A high conversion rate suggests that your marketing efforts are successfully resonating with your target audience and leading them towards the intended action. Conversely, a low conversion rate can signal issues with various aspects of your marketing funnel, such as targeting, messaging, user experience, or call to action.
Calculating the conversion rate is straightforward: Divide the number of conversions by the total number of visitors or leads, and multiply by 100 to express it as a percentage. For example, if your website had 10,000 visitors and 200 of them made a purchase, your conversion rate would be 2%.
Tracking conversion rates across different marketing channels and campaigns allows you to identify top performers and areas for improvement. This data-driven approach empowers you to optimize your strategies for maximum impact.
Click-Through Rate (CTR)
Click-through rate (CTR) is a key performance indicator (KPI) that measures the percentage of people who click on a specific link, advertisement, or call to action after seeing it. It is a crucial metric for evaluating the effectiveness of online marketing campaigns, email marketing, and even social media engagement.
A high CTR generally indicates that the content is resonant with the target audience and that the call to action is compelling. Conversely, a low CTR suggests the need for optimization. This might involve revising the ad copy, targeting a different audience, or adjusting the placement of the call to action.
CTR is calculated by dividing the number of clicks by the number of impressions (views) and multiplying by 100 to express it as a percentage.
| Metric | Formula |
|---|---|
| CTR | (Clicks / Impressions) * 100 |
Bounce Rate
Bounce rate represents the percentage of visitors who enter a single page on your website and then exit without interacting further. A high bounce rate can indicate several issues, such as poor user experience, irrelevant content, or technical problems. Monitoring your bounce rate is crucial for understanding how well your website engages visitors.
Calculating bounce rate is straightforward. It is the number of single-page sessions divided by the total number of sessions, expressed as a percentage.
A high bounce rate isn’t always negative. For example, a blog post that comprehensively answers a user’s question might satisfy their needs without requiring further exploration. However, for pages designed to lead users deeper into your website, such as landing pages or product pages, a high bounce rate may signal a need for improvement. Analyzing bounce rate alongside other metrics provides a more comprehensive understanding of website performance.
Reducing bounce rate involves various strategies, including improving page load speed, ensuring mobile-friendliness, refining content relevance, and optimizing call-to-actions.
Return on Ad Spend (ROAS)
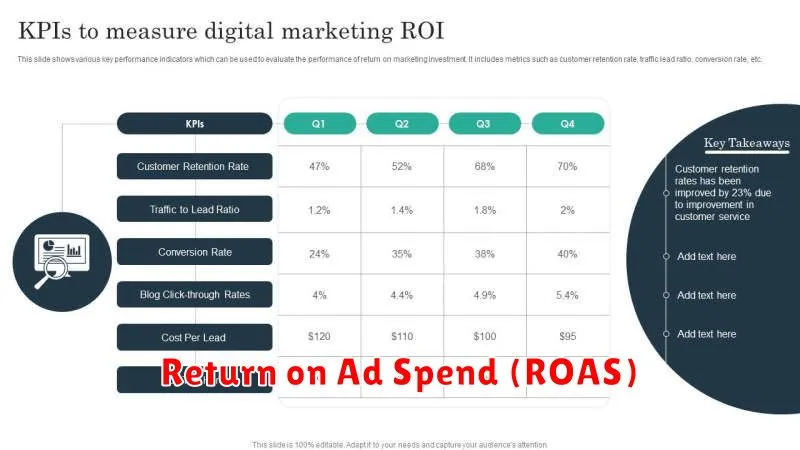
Return on ad spend (ROAS) measures the effectiveness of your advertising campaigns. It tells you how much revenue you generate for every dollar spent on advertising. A higher ROAS indicates a more effective and profitable advertising strategy.
Calculating ROAS is straightforward: divide the total revenue generated by your advertising campaigns by the total cost of those campaigns. For example, if you spent $1,000 on advertising and generated $4,000 in revenue, your ROAS is 4:1 (or 400%).
Monitoring ROAS helps optimize campaign performance. By analyzing ROAS across different channels and campaigns, you can identify high-performing areas and allocate budget more effectively. A low ROAS might suggest the need to revise targeting, messaging, or channel selection.
Engagement Rate
Engagement rate measures how actively your audience interacts with your content. It’s a crucial KPI for understanding the effectiveness of your marketing efforts in fostering a connection with your target audience.
Calculating engagement rate can vary based on the platform and the type of content. Common metrics used in calculating engagement include likes, comments, shares, saves, and retweets. A higher engagement rate generally suggests more effective content and a more connected audience.
Why is it important?
- Indicates content effectiveness
- Shows audience interest
- Helps identify top performing content
How to improve it?
- Create high-quality, relevant content
- Ask questions and encourage interaction
- Run contests and giveaways
- Respond to comments and messages
Lead-to-Customer Ratio
The lead-to-customer ratio is a key performance indicator (KPI) that measures the effectiveness of your marketing efforts in converting leads into paying customers. It’s calculated by dividing the total number of new customers acquired by the total number of leads generated within a specific time period.
This ratio provides valuable insights into the efficiency of your sales funnel and the overall success of your marketing campaigns. A higher ratio indicates a more effective lead generation and nurturing process, while a lower ratio suggests areas for improvement.
Tracking this metric allows you to identify bottlenecks in your sales process and optimize your marketing strategies to improve conversion rates. For example, if you have a large number of leads but a low lead-to-customer ratio, it may indicate a problem with lead qualification or sales follow-up.
By understanding your lead-to-customer ratio, you can make data-driven decisions to refine your marketing efforts and maximize your return on investment (ROI).
Organic Traffic Growth
Organic traffic growth measures the increase in visitors coming to your website from unpaid search engine results. It’s a key performance indicator (KPI) for content marketing and SEO effectiveness.
Tracking organic traffic growth helps you understand how well your content strategy is attracting potential customers naturally. Consistent growth indicates strong SEO performance and valuable content that resonates with your target audience.
Analyzing organic traffic involves examining metrics such as:
- Organic search impressions: How often your website appears in search results.
- Click-through rate (CTR): The percentage of impressions that result in clicks to your website.
- Average position: Where your website ranks in search results for relevant keywords.
By monitoring these elements, you can identify areas for improvement in your SEO strategy and content creation, ultimately driving more qualified leads to your website.
Email Open Rate
Email open rate measures the percentage of recipients who open a given email campaign. It provides insights into how effective your subject lines are at grabbing attention and encouraging opens. A low open rate suggests issues with subject lines, deliverability, or audience targeting. Conversely, a high open rate indicates effective subject lines and relevant content that resonates with the audience.
Tracking email open rates helps you refine your email marketing strategy. By analyzing open rates alongside other metrics, such as click-through rates, you can identify areas for improvement. For example, A/B testing different subject lines can provide data-driven insights into what language resonates best with your target audience.
While a valuable metric, open rates should not be the sole measure of email marketing success. Focus on combining a strong open rate with other key metrics, like click-through and conversion rates, to gain a comprehensive understanding of your campaign’s performance.