
In today’s competitive market, leveraging data is no longer a luxury but a necessity for successful marketing. Data-driven marketing empowers businesses to understand their target audience deeply, personalize campaigns, and optimize marketing strategies for maximum impact. This article explores practical steps and effective techniques to harness the power of data and elevate your marketing campaigns to new heights of success. Learn how to gather, analyze, and interpret data insights to make informed decisions and achieve measurable results. From understanding key performance indicators (KPIs) to implementing A/B testing, unlock the potential of data analytics to refine your approach and achieve your marketing objectives.
Whether you are a seasoned marketer or just starting out, understanding how to utilize data analytics can significantly improve your marketing campaigns. This guide will delve into the crucial aspects of data-driven marketing, providing you with a comprehensive framework for leveraging data insights to refine your strategies, optimize your spending, and ultimately, achieve a higher return on investment (ROI). Discover the power of data visualization, learn to identify valuable data sources, and gain actionable strategies for using data to create more effective and targeted marketing campaigns that resonate with your target audience and drive tangible business growth.
Setting Clear Marketing KPIs
Key Performance Indicators (KPIs) are crucial for measuring the success of your marketing campaigns. Clearly defined KPIs provide quantifiable metrics to track progress and demonstrate return on investment (ROI).
Choosing the right KPIs depends on your specific campaign goals. For a brand awareness campaign, relevant KPIs might include reach, impressions, and social media engagement. Lead generation campaigns, however, would focus on KPIs like website conversions, cost per lead, and lead quality.
Consider these examples when selecting your KPIs:
- Website Traffic: Track unique visitors, page views, and bounce rate.
- Conversion Rate: Measure the percentage of visitors completing a desired action (e.g., purchase, form submission).
- Customer Acquisition Cost (CAC): Calculate the cost of acquiring a new customer.
- Return on Ad Spend (ROAS): Determine the revenue generated for every dollar spent on advertising.
By establishing clear and measurable KPIs aligned with your campaign objectives, you can effectively evaluate performance, identify areas for improvement, and optimize your marketing strategies for better results.
Collecting Data from Multiple Channels
In today’s interconnected world, your marketing campaigns likely span numerous channels. Effective data analysis requires collecting data from all these sources to gain a holistic view of customer behavior. This includes website analytics, social media engagement, email marketing performance, CRM data, paid advertising metrics, and even offline channels like in-store purchases or event attendance.
Centralizing this data is crucial. Consolidating information into a single platform, such as a marketing analytics dashboard or data warehouse, facilitates more comprehensive analysis. This allows you to track the entire customer journey, identify patterns across channels, and understand how different touchpoints influence conversions.
Data integration can be challenging. Different channels often use different formats and metrics. It’s essential to establish clear processes for data collection, cleaning, and transformation to ensure data quality and consistency. Utilizing tools specifically designed for data integration can streamline this process.
Using Data to Understand Customer Behavior
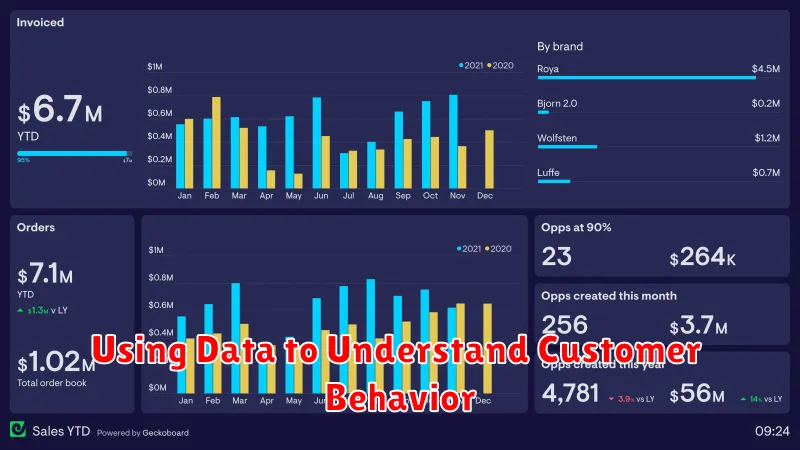
Data analysis plays a crucial role in understanding customer behavior. By examining various data points, businesses can gain valuable insights into their target audience.
Key data to consider includes demographics (age, location, gender), purchase history, website activity (pages visited, time spent), and engagement with marketing campaigns (email opens, click-through rates). Analyzing this information can reveal patterns and trends in customer behavior.
For example, analyzing website traffic data can identify which products or services are most popular. Purchase history combined with demographics can reveal specific customer segments with varying purchasing habits. This information empowers businesses to tailor marketing strategies and create targeted campaigns.
Understanding customer behavior through data analysis is essential for optimizing marketing efforts and achieving better results.
Running Data-Driven A/B Tests
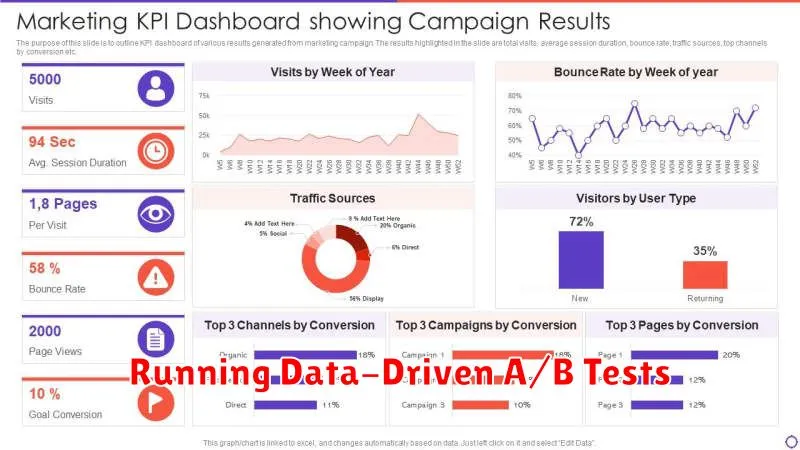
A/B testing is a critical component of data-driven marketing. It allows you to compare two versions of a campaign element, such as an email subject line or a call-to-action button, to determine which performs better.
Start by defining a clear objective. What do you want to achieve with your A/B test? Increased click-through rates? Higher conversion rates? Once you’ve identified your goal, select the element you want to test. Keep it focused; testing too many variables at once can muddy the results.
Next, create two versions (A and B) of your chosen element. Version B should have just one key difference from Version A. This isolates the impact of the change and provides clearer insights.
Randomly assign users to either group A or B. Ensure a statistically significant sample size for each group to ensure reliable results. Monitor the performance of each version against your chosen metric. Statistical significance calculators can help you determine when you’ve reached a reliable conclusion.
Visualizing Metrics for Better Reporting
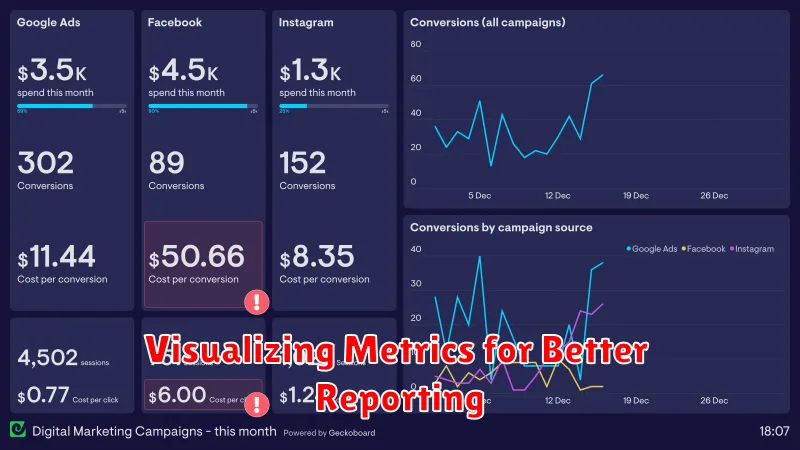
Data visualization transforms raw marketing metrics into easily digestible insights. Charts and graphs communicate complex data points more effectively than tables or text, enabling quicker understanding and informed decision-making.
Choosing the right visualization method is crucial. Line graphs are excellent for tracking trends over time, such as website traffic or conversion rates. Bar charts compare different campaigns or channels, highlighting performance variations. Pie charts display proportions, useful for understanding audience demographics or budget allocation.
Visualizations also facilitate identifying outliers and anomalies. A sudden spike or dip in a graph can prompt investigation, uncovering unexpected issues or opportunities. This proactive approach allows for timely adjustments to your marketing strategies.
Turning Insights Into Action
Analyzing data is only the first step. The true value lies in translating those insights into actionable strategies that improve your marketing campaigns. This requires a structured approach and a commitment to iterative improvement.
Prioritize Key Findings: Focus on the most impactful insights. Don’t try to address everything at once. Prioritize changes that are likely to yield the greatest return on investment.
Develop Actionable Strategies: Translate your insights into specific, measurable, achievable, relevant, and time-bound (SMART) objectives. For example, if your data reveals a high bounce rate on a specific landing page, a SMART objective might be to reduce the bounce rate by 10% within the next month by improving the page’s user experience.
Implement and Test: Put your strategies into action. A/B testing is crucial for determining the effectiveness of your changes. Compare the performance of the new strategy against the previous one to measure the impact.
Monitor and Iterate: Continuously monitor the performance of your campaigns and be prepared to adapt your strategies based on the ongoing data analysis. Marketing is a dynamic process, and consistent monitoring and iteration are key to long-term success.
Adjusting Strategy Based on Analytics
Data analysis is crucial for optimizing marketing campaigns. Regularly reviewing your analytics allows you to identify what’s working and what isn’t, enabling data-driven adjustments to your strategy.
Key metrics to consider include conversion rates, click-through rates (CTR), and customer acquisition cost (CAC). Low conversion rates may indicate issues with your landing pages or call to action. Poor CTR could signal problems with ad copy or targeting. High CAC might suggest inefficiencies in your spending or targeting strategy.
Based on these insights, adjustments can be made. For example, A/B testing different landing pages can improve conversion rates. Refining targeting parameters can enhance CTR and lower CAC. Continuously monitoring and iterating based on data analysis is key to maximizing campaign performance.