
In today’s digital landscape, social media has become an indispensable tool for businesses of all sizes. Effectively leveraging these platforms requires more than just posting content; it requires strategic measurement and analysis. Tracking the right social media metrics provides invaluable insights into campaign performance, audience engagement, and overall return on investment (ROI). Understanding which metrics are most relevant to your business objectives is crucial for optimizing your social media strategy and achieving meaningful results. This article will explore the top 10 social media metrics you should be tracking to maximize your impact and achieve your social media marketing goals. Whether you’re focused on brand awareness, lead generation, or driving sales, understanding these key performance indicators (KPIs) will empower you to make data-driven decisions and refine your approach.
From engagement rate and reach to conversion rate and customer lifetime value, we’ll delve into the significance of each metric and how it contributes to a comprehensive understanding of your social media performance. By mastering these social media analytics, you can identify areas for improvement, refine your content strategy, and ultimately achieve a stronger social media presence. This article provides a practical guide to the essential social media metrics that every marketer should be monitoring, offering valuable insights to optimize your social media efforts and drive business growth. Get ready to unlock the power of social media measurement and transform your social media strategy into a powerful engine for success.
Engagement Rate
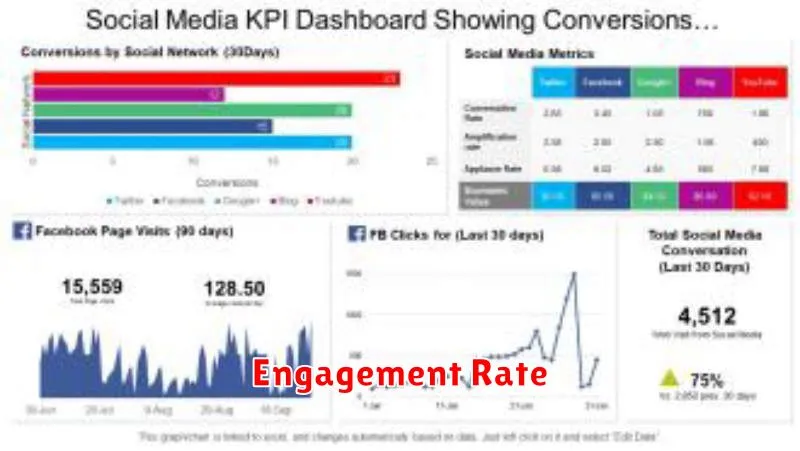
Engagement rate measures how actively your audience interacts with your content. It’s a crucial metric for understanding the effectiveness of your social media strategy and how well you’re resonating with your followers.
Calculating engagement rate can vary depending on the platform and your specific goals. Common methods involve dividing the total number of engagements (likes, comments, shares, etc.) by your reach or total followers, then multiplying by 100 to express it as a percentage. A higher engagement rate generally indicates stronger audience interest and connection.
Tracking engagement rate helps you understand which content performs best, identify trends, and optimize your posting strategy for maximum impact. Consistently monitoring this metric allows you to refine your approach and improve your overall social media performance.
Impressions and Reach
Impressions represent the total number of times your content was displayed, regardless of whether it was clicked or not. A single user can generate multiple impressions. For example, if a user scrolls past your post twice, that counts as two impressions.
Reach, on the other hand, measures the unique number of users who saw your content. While impressions can tell you how often your content was displayed, reach provides insight into how many individual people your content has touched.
Tracking both metrics is crucial. High impressions with low reach could suggest your content isn’t resonating broadly enough to engage new audiences. Conversely, high reach with low impressions might mean your content is being seen by many unique users, but isn’t compelling enough for repeated views.
Click-Through Rate (CTR)
Click-Through Rate (CTR) measures how often people click on a link within your social media content after viewing it. It’s a crucial metric for understanding the effectiveness of your calls to action and the overall engagement your content generates. A high CTR suggests your content resonates with your audience and compels them to take the desired action.
Calculating CTR: CTR is calculated by dividing the number of clicks your content receives by the number of impressions (times your content was displayed) and multiplying by 100 to express it as a percentage.
Factors affecting CTR: Several factors influence CTR, including the quality of your content, the compelling nature of your call to action, the targeting of your audience, and the platform you are using. A strong headline and engaging visuals can significantly impact CTR.
Improving CTR: Regularly analyzing your CTR data can help you identify what type of content resonates most with your audience. Experiment with different types of content, calls to action, and posting times to optimize your strategy and improve your overall click-through rates.
Follower Growth Rate
Follower growth rate is a key metric for measuring the success of your social media strategy. It tracks the rate at which your follower count is increasing over a specific period.
Calculating this metric is relatively simple. Subtract your previous follower count from your current follower count. Then divide that result by your previous follower count. Finally, multiply by 100 to express the rate as a percentage.
Tracking follower growth rate helps you understand the effectiveness of your content and campaigns. A consistent upward trend indicates that your audience is engaging with your content and finding value in what you share. Conversely, a decline or stagnant growth rate may signal a need to re-evaluate your strategy.
Share of Voice
Share of Voice (SOV) is a crucial metric for understanding your brand’s visibility and prominence within the social media landscape. It measures the percentage of conversations related to your industry or specific keywords that mention your brand, compared to your competitors.
Tracking SOV helps you assess your brand’s market share in the online conversation and identify potential areas for improvement in your social media strategy. A higher SOV generally indicates greater brand awareness and stronger audience engagement.
Calculating SOV involves monitoring mentions of your brand and your competitors across various social platforms. This can be done manually or through specialized social listening tools. The formula for SOV is:
(Your Brand Mentions / Total Industry Mentions) * 100 = SOV
By analyzing SOV alongside other metrics, you can gain valuable insights into the effectiveness of your campaigns and adjust your tactics to amplify your brand’s voice in the social media sphere.
Video View Count
Video view count is a fundamental metric for assessing video performance. It quantifies the number of times a video has been viewed. A ‘view’ is typically counted after a user watches a video for a short duration, often just a few seconds, depending on the platform. Tracking view count helps understand the reach of your videos and their initial engagement levels.
While a high view count suggests widespread visibility, it shouldn’t be analyzed in isolation. Consider using it alongside other metrics like watch time and engagement (likes, comments, shares) to obtain a more holistic understanding of video performance. This provides a more nuanced insight into whether viewers are truly connecting with your content.
Post Saves and Shares
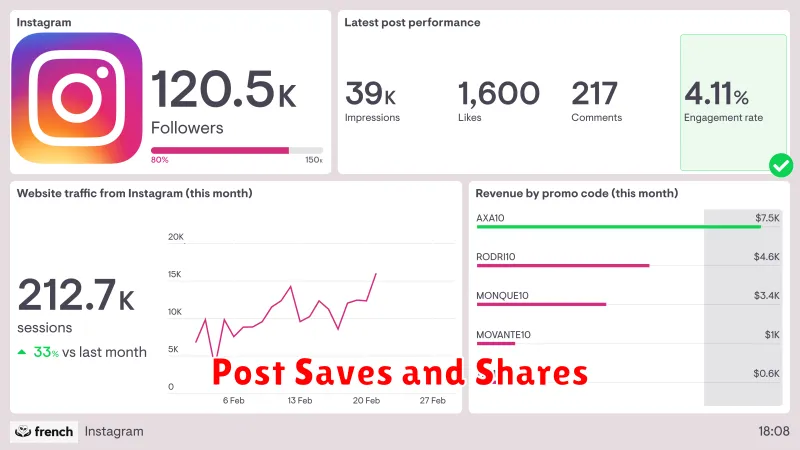
Saves and shares are two crucial metrics providing insight into how your audience values your content. While likes can be fleeting, saves indicate a desire to revisit the content later. This suggests your content is considered valuable enough to be referenced in the future.
Shares demonstrate the audience’s willingness to amplify your message to their own networks. A high share count indicates resonant content that sparks conversation and extends your reach organically. Tracking both saves and shares provides a more complete picture of your content’s long-term impact and its ability to generate engagement beyond initial impressions.
Referral Traffic from Social
Referral traffic from social media platforms indicates how effective your social media strategy is at driving visitors to your website. Tracking this metric helps you understand which platforms are sending the most valuable traffic, ultimately leading to conversions.
Analyze which social media posts are driving the most clicks to your website. This will give you insights into the type of content that resonates with your audience and motivates them to learn more. By understanding this, you can refine your social media content strategy to maximize website traffic.
Consider tracking the bounce rate for traffic originating from social media. A high bounce rate could suggest a disconnect between the content promoted on social media and the content on your landing page. This highlights the importance of aligning your messaging across platforms.
Customer Response Time
Customer Response Time (CRT) measures how quickly your team responds to customer inquiries on social media. It’s a vital metric reflecting your brand’s customer service quality and responsiveness.
A low CRT generally leads to higher customer satisfaction. Customers appreciate quick resolutions to their problems and fast answers to their questions. Tracking CRT can help pinpoint bottlenecks in your workflow and identify areas for improvement in your customer service process.
Several platforms provide built-in analytics that automatically track CRT. You can also calculate it manually by dividing the total time spent responding to customer inquiries by the total number of inquiries responded to within a specific timeframe.
Tips for improving CRT:
- Utilize social media management tools to streamline workflows.
- Establish clear internal processes for handling customer inquiries.
- Empower customer service representatives with the necessary information and tools.
Conversion Rate from Social Ads
Conversion rate measures the effectiveness of your social media advertising in driving desired actions. It represents the percentage of users who click on your ad and complete a specific action, such as making a purchase, signing up for a newsletter, or filling out a form.
Tracking this metric helps you understand which ad campaigns are truly resonating with your target audience and leading to tangible results. A low conversion rate suggests a need to refine your targeting, ad creatives, or call to action. A high conversion rate, conversely, indicates a successful campaign that effectively converts interest into action.
Calculating your conversion rate involves dividing the number of conversions by the total number of ad clicks and multiplying by 100. For example, if you receive 100 clicks on an ad and 5 users make a purchase, your conversion rate is 5%.